


SMART - Social Metrics Analysis and Reporting - Dashboard
This projects consisted of creating a data visualization dashboard for AT&T's internal Technology Development Organization.
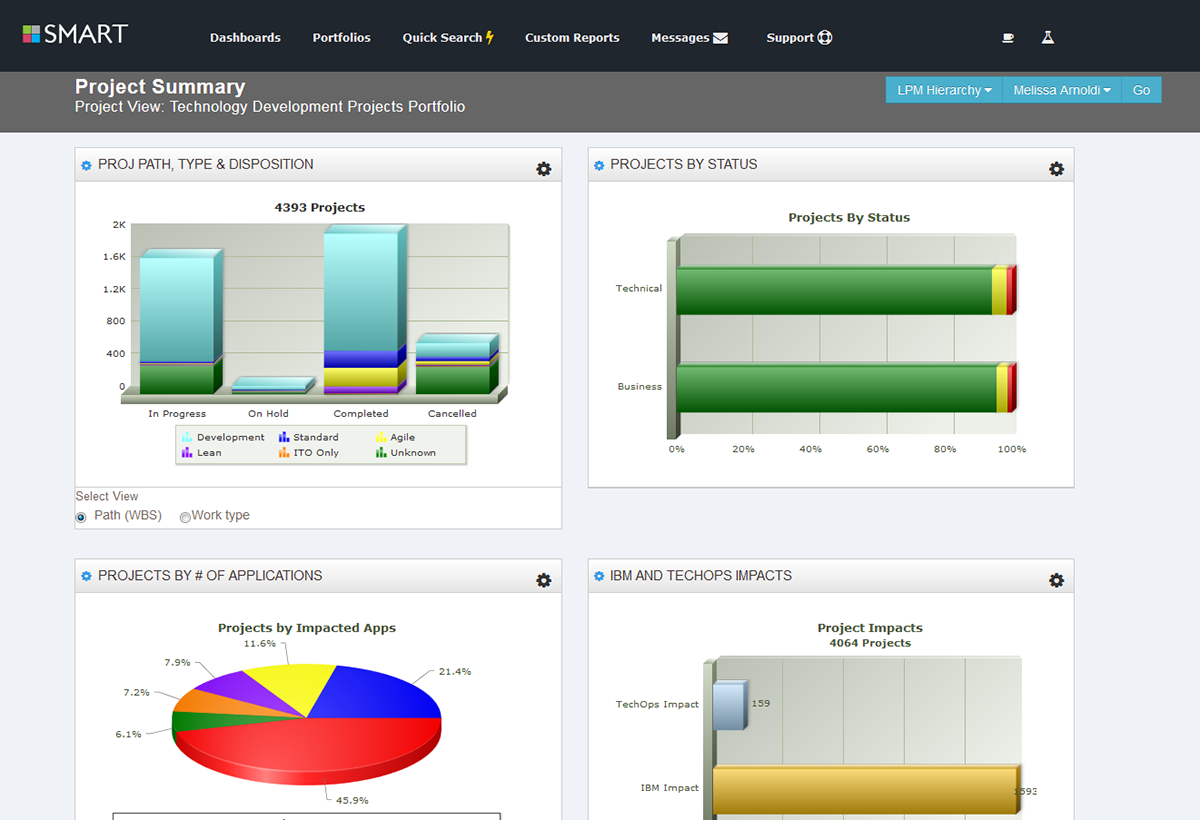
SMART formats daily feeds from unique data sources into customized, actionable, mobile-friendly dashboards and data exports. Using SMART, you can easily navigate through thousands of project records summarized by any level of Delivery Management owner, Technology Solutions Manager, Application impacts, Strategic Priority and much more. Custom views can be created, saved and shared for easy analysis, collaboration and action.


SMART data is Technology Development Project data. Data is displayed in various chart types within the Dashboard. Two views are available (you can switch between Views but before you get started, decide which view you’re interested in right now):
Project View is the most popular view. Typical users of Project View include LPMs, TSMs, LPM and TSM managers, SI Owners, Program and Org oversight owners, financial oversight owners, PMO team members.Typical users of Application View include APMs, APM managers, Application Owners, Application Contacts.
The ability to create customized dashboards/views which could be shared with others and saved as favorites was extremely popular with certain users groups.


Also required were an instructional Wiki, orientation and in-depth instructional videos, and marketing/advertising materials. The dashboard had to be responsive for mobile and tablet consumption. It also had to have access for users inside and outside of the company firewall.


